Welcome to floweaver’s documentation!
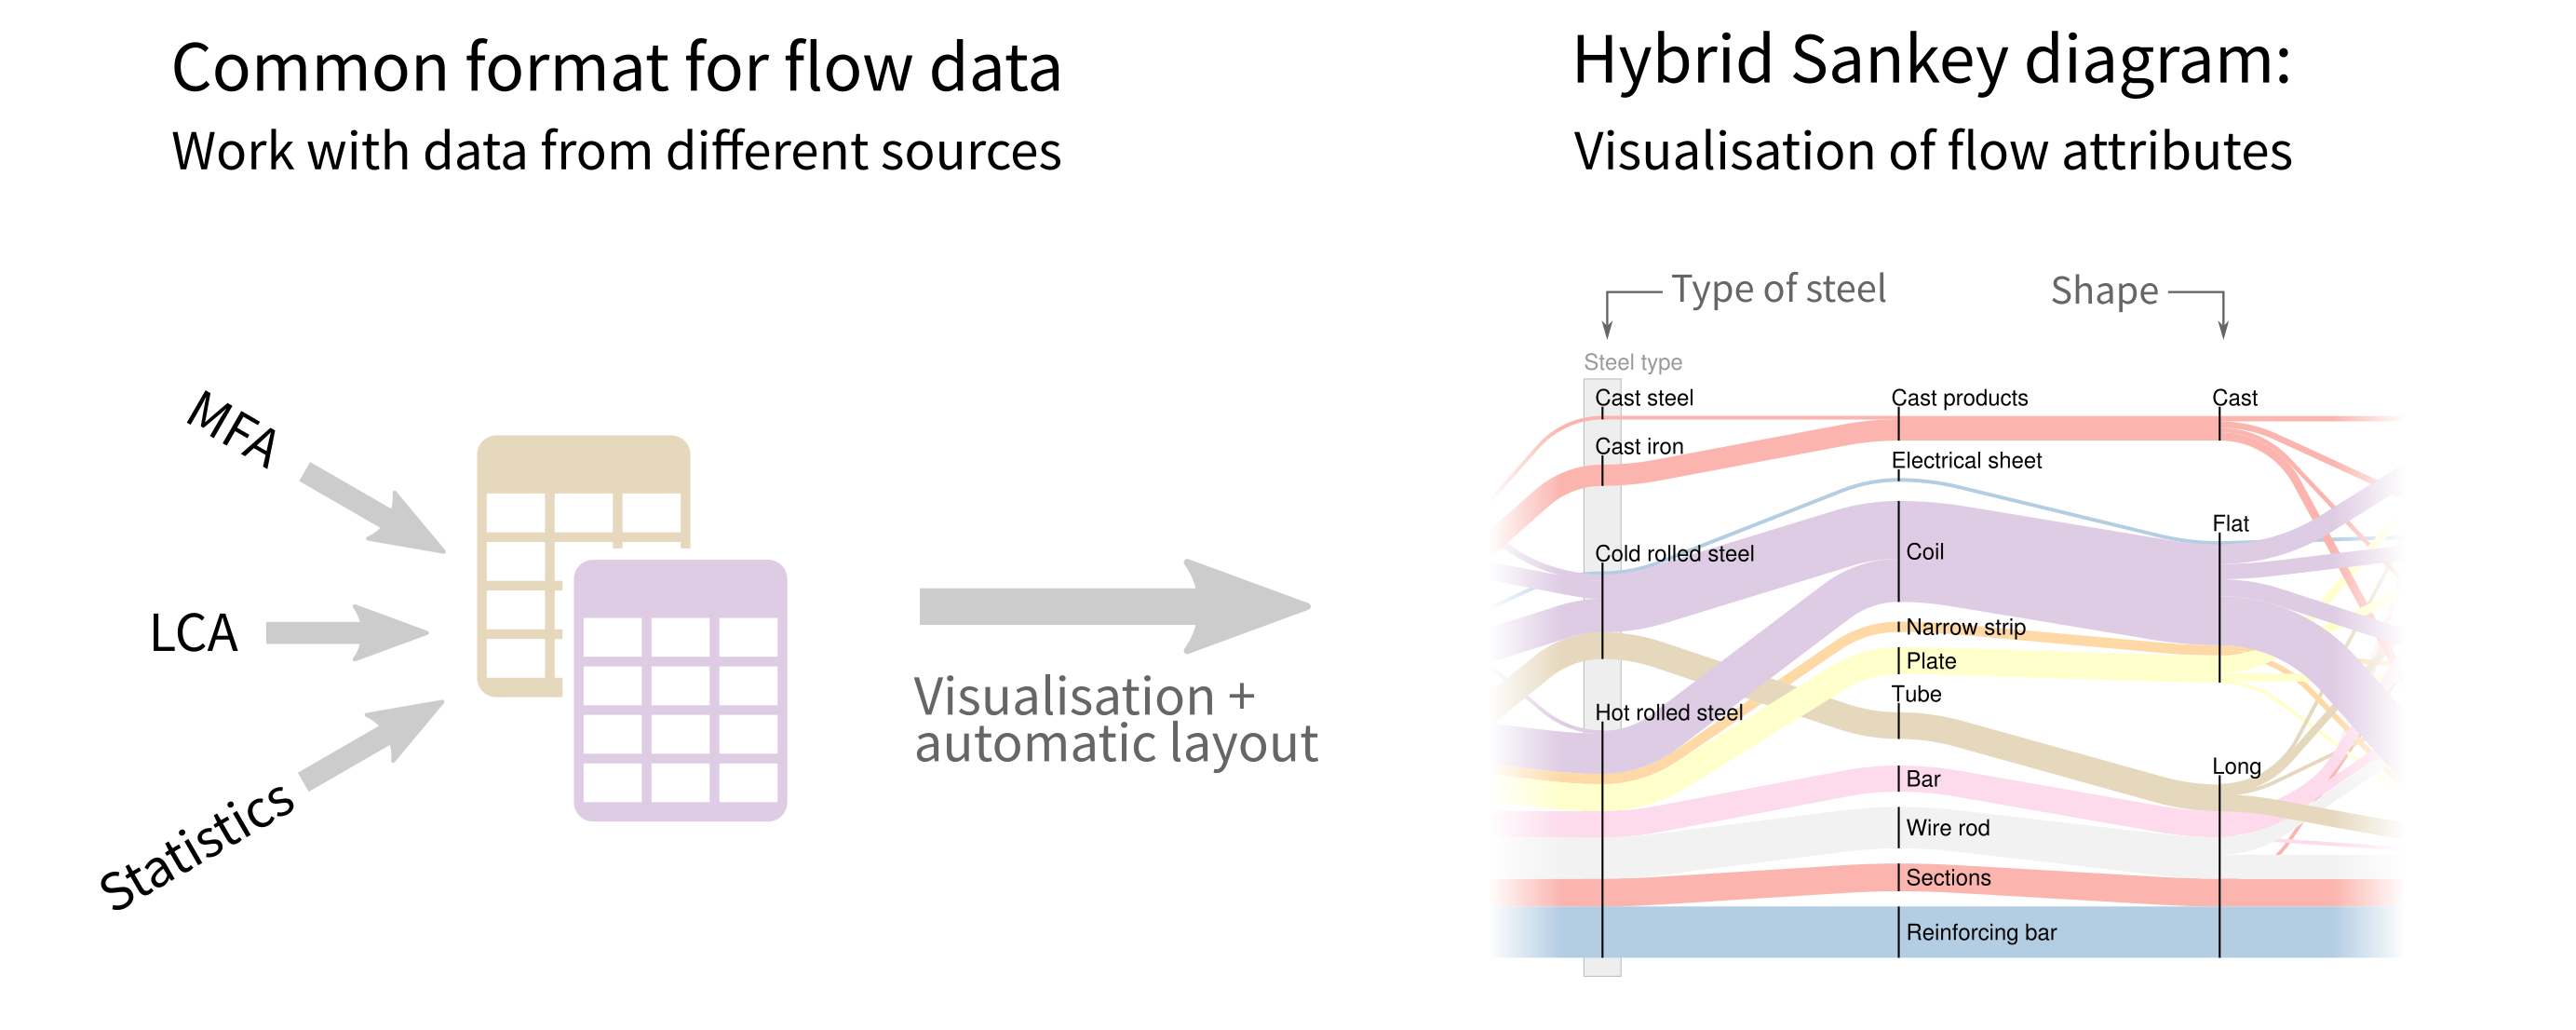
floWeaver generates Sankey diagrams from a dataset of flows. For a descriptive introduction, see the paper Hybrid Sankey diagrams: Visual analysis of multidimensional data for understanding resource use. For a more hands-on introduction, read on.
Getting started
Note
You can try the tutorials online without installing anything! Click here to open MyBinder.
Start by installing floWeaver:
Then the tutorials introduce the concepts used to generate and manipulate Sankey diagrams:
Real-world examples!
The examples gallery has real-world examples of how floWeaver has been used.
Cookbook
Shorter examples of how to do common tasks, and the examples from the journal paper:
API Documentation
- Datasets
- Sankey diagram definitions
- Weaving the Sankey diagram
- Compiling SankeyDefinitions
Contributing
Contributions are very welcome.
Citing floweaver
If floweaver has been significant in a project that leads to a publication, please acknowledge that by citing the paper linked above:
C. Lupton and J. M. Allwood, ‘Hybrid Sankey diagrams: Visual analysis of multidimensional data for understanding resource use’, Resources, Conservation and Recycling, vol. 124, pp. 141–151, Sep. 2017. DOI: 10.1016/j.resconrec.2017.05.002